 StudentAid
Unit 14: States of Matter and Phase Changes — Long Questions
10th Class Chemistry · Unit 14: States of Matter and Phase Changes
States of Matter
Matter in this world exists in four physical states namely gas, liquid, solid and plasma. Out of these four states the properties of gases were studied first.
Motion of molecules
It was suggested that physical properties of gases such as their ability to compress or expand, or diffuse could be understood by assuming that these gases consist of particles which are continuously moving randomly.
Kinetic particle theory
• Concept of the continuous movement of particle then led to formulation of kinetic particle theory for gases.
• Kinetic particle theory not only explains all the laws which govern the behaviour of gases, it also explains the composition of liquid and solid states of matter and the interconversion of all the three states. This is natural because all the three physical states are distinct in their physical properties only while their chemical nature remains the same.
Example: Water in all its three physical states remains chemically the same compound.
Kinetic particle theory about gases
According to kinetic particle theory, gas molecules possess the following properties.
(i) Random motion: Gases are composed of particles which are in a continuous state of random motion in all the possible directions.
(ii) Pressure: The pressure exerted by a gas is due to the collisions of its particles with the walls of the container
(iii) Collision of molecules: Since the pressure of a gas in a container does not change with time at constant temperature, it is assumed that the collisions between its particles do not involve any loss or gain of energy due to friction.
(iv) Forces of attraction: The attractive forces between the particles of a gas are assumed as negligible since the particles are widely apart at low pressure.
(v) Kinetic energy: The average kinetic energy of the particles is directly proportional to the temperature measured on kelvin scale. The average kinetic energy is the same for all gases at the same temperature.
Kinetic particle theory about liquids
According to kinetic particle theory, liquids exhibit following properties.
(i) Movement: The particles in a liquid are quite close to one another and are moving in all possible directions.
(ii) Shape: They are moving in all possible directions. As a result, the particles of a liquid do not have any fixed position and shape.
(iii) Volume: Owing to the presence of inter-particle forces, however, a liquid has a fixed volume and it keeps its level as well.
(iv) Types of movements: In a liquid, the particles show all the three types of movements.
Solids
Solid substances may consist of ions, atoms and molecules.
Kinetic particle theory about solids
According to kinetic particle theory, solids exhibit following properties.
(i) Forces of attraction: The inter-particle forces in the solid substances are so strong that they keep their particles arranged in a fixed position.
(ii) Motion: These particles possess vibrational motion only.
(iii) Shape and volume: These restricted movements force solid substances to have a fixed shape and a fixed volume.
Internal energy
The internal energy of a substance is the total energy it contains. It includes the kinetic energy of its particles and the potential energy due to bonding between them.
Heat increases the internal energy of a system.
Interconversion of physical states
Physical states of matter can be interconverted to each other by adding or removing heat. It can also be done by changing both temperature and pressure.
Here we are discussing the change affected by heat only.
Conversion of a solid into a liquid (Melting)
The physical state of a solid substance can be changed by simple heating.
• Heat increases the kinetic energy of the particles and they start vibrating at a higher frequency.
• At a particular temperature their vibrational motion becomes so fast that it overcomes the cohesive forces. As a result, the solid starts melting and this temperature is called the melting point of the solid.
• Melting point: It is defined as the temperature at which a solid changes its state to become a liquid.
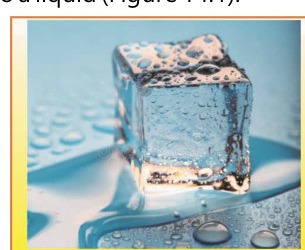
• At the melting point, the particles of a solid not only lose their mean positions but the arrangement as well. The solid collapses and turns to a liquid figure 14.1.
Temperature remains constant at melting point
• Heating a solid below its melting point increases its kinetic energy and temperature that weakens the force of attraction between its particles.
• Further heating the solid after it has started melting does not increase its temperature. Instead, all the heat energy provided at this moment is utilized to convert the solid into its liquid.
(i) Conversion of a liquid into a gas (Boiling)
When a liquid boils it turns into a gas. It may also take place by a phenomenon of evaporation that occurs at all temperature. The molecules of a liquid keep on coming out from the surface of a liquid at all temperatures and such an escape of molecules from surface is called evaporation.
Effect of heat on liquid state
• Heating a liquid increases the kinetic energy of its molecules and so does the process of evaporation.
• Heating the liquid further, increases the kinetic energy so much that the inter-particle forces are weakened to a large extent. At this point the bubbles start coming out of the liquid at a rapid pace.
• At this stage if the vapour pressure of the liquid becomes equal to the external pressure, the liquid starts boiling.
• Boiling Point: The temperature of a liquid at which its vapour pressure becomes equal to the atmospheric or external pressure is called its boiling point.
Temperature remains constant after boiling point: At the boiling point, the heat provided to the liquid is used to convert it into gaseous form and during this its temperature remains constant. In other words, the heat provided is used only to break the forces of attraction between its particles.
(ii) Conversion of a gas into its liquid (Condensation)
• When a gas is cooled, the kinetic energy of its molecules decreases, as a result the molecules come closer with a significant force of attraction between them.
• At a suitable lower temperature, the increased attractions bring the molecules so close that they are changed into a liquid form. This is called condensation.
• During this transition the temperature of the gas remains constant until all the gas is changed into its liquid.
Example Rain is the natural example of condensation or liquefaction.
Heating and cooling curves
Interconversion of physical states can also be understood with the help of a graph drawn between the internal energy and the temperature of a system. Such a graph is also called a heating or cooling curve.
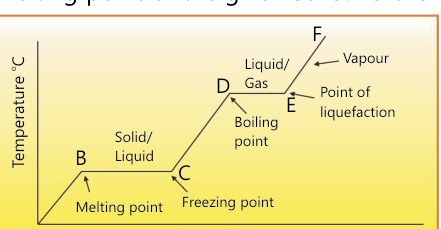
Figure 14.2 shows such a curve when a substance is heated or cooled.
Heating curve
A heating curve is a graph that shows how the temperature of a substance changes over time as heat is added. The graph is plotted between temperature and internal energy. It consists of several distinct segments
(i) Segment A to B: When a solid substance at a point A is heated, its temperature increases. On attaining a specific temperature, it melts as shown by the point B in the figure 14.2. This point represents the melting point of the given solid.
(ii) Segment B to C: Further heating does not increase the temperature because the heat provided here is being utilized to melt all the solid substance as represented by the line B to C.
(iii) Segment C to D: When all the solid converts into the liquid the temperature starts rising again as shown in the graph for the points C to D. At the temperature corresponding to point D the liquid starts boiling. This represents the boiling point of the liquid.
(iv) Segment D to E: Again, further heating does not increase the temperature till the whole liquid is converted into gas. A line D to E in the figure shows no further rise in the temperature.
(v) Segment E to F: The temperature again starts rising after the point E.
This curve represented by the steps from A to F is called a heating curve.
Cooling curve
Cooling curves is the graph that shows how temperature of substance changes over time as heat is removed. The graph is plotted between temperature and internal energy. The same heating curve can be studied in the reverse direction from point F to A is called cooling curve. It has following parts or segment as shown in figure 14.2.
(i) Segment F to E: When the gas present at the point F is cooled its temperature starts decreasing. At the point E it starts converting into a liquid. This is called the condensation point or liquefaction point and it represents the same temperature as the boiling point.
(ii) Segment E to D: The temperature will however remain constant during this process of condensation or liquefaction.
(iii) Segment D to C: Further cooling will convert the liquid into solid at the point C which is called the freezing point and it represents the same temperature as the melting point.
(iv) Segment C to B: The line C to B shows that the process of cooling is converting all the liquid into solid state at constant temperature.
(v) Segment B to A and below: The temperature of the solid decreases as it continues to lose heat. The kinetic energy of the particles decreases, causing them to vibrate less.
Heating curve for water
A heating curve is a graph that shows how the temperature of water changes when heat is supplied to it.
It consists of several distinct segments or parts.
(i) Segment A to B – Heating of ice (Solid)
For water, a heating curve will show the rise of temperature of ice until it reaches 0°C (melting point).
(ii) Segment B to C – Melting (Solid →Liquid)
It remains constant while the ice melts into liquid water
(iii) Segment C to D – Heating of water (Liquid)
Further heating will increase the temperature again until it reaches 100°C (boiling point).
(iv) Segment D to E – Boiling (Liquid →Gas)
At this point it remains constant while the liquid water is converted into steam.
(v) Segment E to F – heating of steam (Gas)
Temperature rises again. Gas particles move even faster, far apart with high kinetic energy.
Cooling curve for water
The same graph of heating curve of water is studied in reverse order to show cooling curve. It consists of several distinct segment or parts.
(i) Segment F to E: A cooling curve for water will show the temperature of the steam decreasing until it reaches 100°C.
(ii) Segment E to D: It then remains constant while the steam condenses into liquid water.
(iii) Segment D to C: The temperature decreases again until it reaches 0°C.
(iv) Segment C to B: Finally, it remains constant while the liquid water changes to ice. Lines B to C and D to E show that here the given energy is being utilized to change the phase from solid to liquid and from liquid to gas respectively.
Key points Evaporation | Relationship between Evaporation and Boiling
Evaporation
The molecules of a liquid keep on coming out from the surface of a liquid at all temperatures and such an escape of molecules from surface is called evaporation.
Explanation When water is taken in an open container at normal external pressure, vapours start coming out of its surface silently and steadily. It is shown by the decrease in the level of water surface in the open container. It is called evaporation and it is known to occur at all temperatures.
Factors affecting Temperature, intermolecular forces and surface area affect the rate of evaporation.
Relationship between evaporation and boiling
- Increasing the temperature of water increases the rate of evaporation because the number of water molecules escaping the surface also increases.
- The temperature will keep on increasing until a stage will come at which the water molecules acquire the maximum value of kinetic energy while in a liquid state.
- The heat which is provided at this stage will be utilized to change the liquid water into gaseous water while keeping the temperature of water constant. This stage is called boiling.
- The whole process is being carried out at constant atmospheric pressure.
Key point Difference of Evaporation and Boiling
Evaporation
(i) It is a surface phenomenon. It occurs slowly and only at the surface of the liquid.
(ii) It occurs at all temperatures but below the boiling point. It increases with increase in temperature and vice versa.
(iii) It produces cooling.
(iv) It requires a smaller amount of energy which is provided from inside the liquid.
Boiling
(i) A phase change when a liquid turns into a gas throughout the entire liquid forming bubbles, at a definite external atmospheric pressure.
(ii) It occurs at a specific temperature at normal pressure and called the boiling point.
(iii) It does not result in cooling.
(iv) It requires an external energy source.
Key point Effect of External Pressure on the Rates of Evaporation and Boiling
Effect of external pressure on the rates of evaporation and boiling
Rates of both evaporation and boiling are affected by the variation in the external pressure to which the liquid is subjected.
Effect of external pressure on evaporation
- Rate of evaporation tends to increase by the decrease in external pressure and vice versa.
- If a liquid is in an open container, most of the molecules that escape into the vapour phase will not return to the liquid phase. Instead, they will diffuse through the atmosphere away from the container.
- Increasing the external pressure will force these molecules to return back to the liquid surface making evaporation difficult.
Effect of external pressure on boiling
External pressure effect directly on boiling of a liquid. When a liquid boils, bubbles are formed inside the container, which then rise to the surface. At this stage, the temperature of the liquid remains constant till all the liquid boils over. This temperature is called the boiling point.
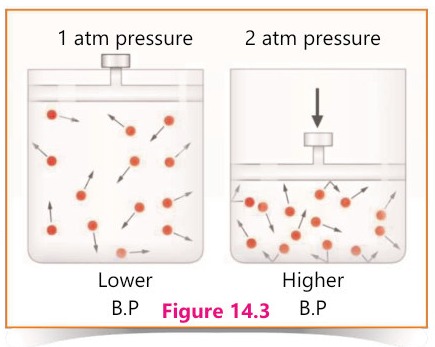
Example If you measure the boiling point of water at Karachi it will be 100°C. However, if you will measure this boiling point at Murree it will be 98°C. The atmospheric pressure at Murree is lower than that in Karachi, so it is found that the boiling point has decreased at lower atmospheric pressure.
Figures Fig 14.3 shows the effect of pressure on boiling point.
Key points Sublimation | Deposition
Sublimation
The direct conversion of a solid to vapours without melting is called sublimation. Conversion of solid into gaseous state without passing through a liquid phase is sublimation.
Examples
The examples of sublimation are:
(i) Dry Ice: Solid carbon dioxide which is also called dry ice, changes directly to gaseous carbon dioxide at room temperature without first melting to liquid state.
(ii) Naphthalene balls: Another common example of sublimation is the disappearance of naphthalene balls which are used to keep the insects away from the woolen clothes.
Energy for sublimation Just like evaporation, the energy needed for sublimation also comes from within the substance which then absorbs energy from the surrounding. This energy is sufficient to overcome the attractive forces of the neighbouring molecules which then escape into the vapour phase.
Deposition (Gas to solid)
The process reverse to sublimation is called deposition where a gas changes directly to a solid without going into the liquid state.
Example Formation of frost in winter season is an example of deposition.
Relation of sublimation and deposition: Sublimation and deposition are inversely related to each other. Sublimation is the conversion of solid into gas and deposition is the conversion of gas into solid.
Key points Solid Air Fresheners | Sublimation Printing
Solid air fresheners
- The process of sublimation is used in the working of air fresheners.
- Solid air fresheners contain a scented substance which may evaporate with or without heating.
- The scented substance undergoes sublimation and disperse scented vapours throughout the room and mask unpleasant odours.
Kinetic Particle theory and sublimation of solid air fresheners
- When a solid air freshener is exposed to the atmosphere or heated in the air, its solid particles gain enough energy to overcome the attractive forces holding them together in the solid state.
- These particles then spread in the nearby atmosphere in the form of sweet smelling vapours.
Sublimation printing
When the process of sublimation is used to print a design into a material or fabric, it is called sublimation printing. Essentially the process involves printing that transfers a design into a fabric using ink and heat.
Steps involved in sublimation printing
- In sublimation printing the first step is to print a design onto a special paper using sublimation inks.
- The printed paper is then placed onto a fabric and heat and pressure are applied.
- The inks used are converted into vapour.
Permanent Printing The printing is permanent which does not fade away with time because the ink is embedded in the fabric rather than simple attaching with the top of the fabric in a normal printing.
Role of heat and applied pressure: The heat supplied during the process opens up the pores present in the fabric, the ink enters into these pores under applied pressure, cools down and returns to a solid form.
Application of sublimation printing The method is popular for print on demand t-shirts and it is also available on ceramic, wood and metal that have a special coating on to receive the inks which are sublimed.
Key points Pressure – Volume Relationship (Boyle's law) | Observations
Pressure – Volume relationship (Boyle's law)
- According to Kinetic Theory, the pressure exerted by the gas in a container is caused by the collisions of its molecules with the walls of the container.
- The pressure changes directly with the number of molecules colliding with the wall per unit of time.
Observations
- When the pressure on the given mass of a gas is increased at constant temperature it will decrease the distance between its molecules and the volume of gas will also decrease.
- If the volume of the gas will be reduced to one half of its original volume, it will double the number of molecules per unit of volume. Hence the number of collisions per unit of time on the same area of the surface will also be doubled. As a consequence of these collisions, the pressure of the gas will also be doubled.
- These observations form the basis of a pressure-volume relationship was first observed by an Irish chemist, Robert Boyle, in 1662 and is called Boyle's law.
Boyle's law
Statement: The law states that the volume of a given mass of a gas is inversely proportional to its pressure at constant temperature.
Mathematical form
Mathematically Boyle's law is written as:
V ∝ 1/P (V is the volume of gas and P is its absolute pressure)
V = k 1/P
PV = k = constant
P₁V₁ = P₂V₂
Key point Experimental verification of Boyle's law
Experimental verification of Boyle's law
Robert Boyle proved the pressure volume relationship by performing a simple experiment.
Steps
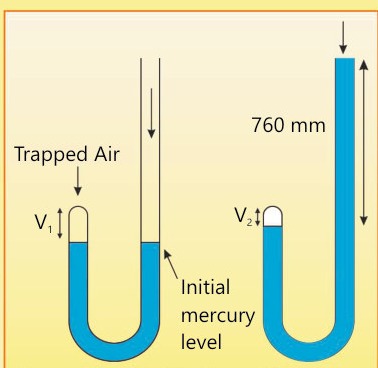
- He used a simple J shaped tube and sealed its shorter limb as shown in the figure 14.4.
- He then poured a small amount of mercury through its open end until it just trapped the air in the sealed end.
- Since he used a small amount of mercury it did not squeeze the air inside the limb and it was now at atmospheric pressure (760 mm Hg).
- Boyle then added more mercury until the difference in the height of the two columns of mercury was close to 760mm.
- This mercury exerted the extra pressure on the entrapped air which was now about 2 atmosphere (2 x 760 mm).
- When he read the new volume of the entrapped air it was one half of the initial volume.
- During the experiment the mass of the gas remained fixed and the temperature also did not change.
Result By doubling the pressure, Boyle had reduced the volume by one half. So, he found an inverse relationship between pressure and volume of a gas.
Figures Fig 14.4: Verification of Boyle's law
Key points Temperature – Volume Relationship (Charles' law) | Observations
Temperature – volume relationship (Charles' law)
According to kinetic theory, if temperature of a gas increases, it increases the average speed and kinetic energy of its molecules.
Observations
- Collision: An increase in average speed results in more frequent and harder collisions with the walls of the container and hence its pressure increases.
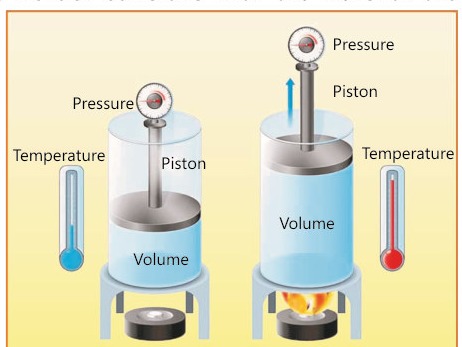
- Increase in volume at constant pressure: If the pressure of the gas is kept constant, the increase in the temperature must increase the volume of the gas.
Use of moveable piston This may be visualized easily if a gas is taken in a cylinder to which a piston is attached. When the gas is heated the piston must move up to increase the volume if the pressure is to remain constant figure 14.5.
French scientist Jacques Alexander Charles in 1780 formulated a law which is called Charles' law.
Charles' law
Statement: This law states that the volume of a given mass of a gas varies directly with temperature when pressure is kept constant. The temperature must, however, be measured on absolute or kelvin scale.
Mathematical form
V ∝ T (P and mass of gas are kept constant)
V = kT
V/T = k = Constant
V₁/T₁ = V₂/T₂
Key points Avogadro's law | Observations
Avogadro's law
According to kinetic theory, the pressure exerted by a gas is due to the number of collisions of its particles per unit area. This, in turn, depends upon the number of particles and their speed.
Observations
- If you have two containers containing the same amount of a gas at the same temperature and pressure, and you increase the amount of gas in one container.
- Naturally the pressure of the gas in this container will increase.
- To keep the pressure constant the volume of the gas must increase. This larger volume compensates for the increased number of particles, ensuring the pressure remains the same.
- At constant temperature and pressure, a greater number of molecules simply requires a larger volume to maintain the same pressure.
- These observations led Avogadro to formulate a law called Avogadros' law.
Avogadros' law
Statement: This law states that equal volumes of different gases must contain an equal number of molecules if the temperature and pressure are kept constant.
Mathematical form
Avogadro's law is written as:
V ∝ n (at constant temperature and pressure)
V = kn
V/n = k = constant
For two different conditions:
V₁/n₁ = V₂/n₂

Key points Diffusion | Factors Affecting the Rate of Diffusion
Diffusion
It is a process by which particles (molecules) move from origin of higher concentration to lower concentration until they are equally spread.
Explanation Molecules present in gases are in a constant state of random motion. Due to this molecular motion the gas particles spread out and intermix from an area of high concentration to an area of low concentration. This property of gases is called diffusion.
Example When a bottle of body perfume is opened in one corner of a room its sweet smell slowly spreads throughout the room after sometime due to the process of diffusion. Figure14.6. shows the diffusion of hydrogen gas from one container to another one.
Spontaneous process Diffusion is a spontaneous process during which gas particles spread out.
Factors affecting the rate of diffusion
1. Kinetic energy: The difference in the rates of diffusion of gases can be explained with the help of kinetic particle theory of gases. According to the kinetic theory, molecules of all the gases possess same average kinetic energy at constant temperature.
Example Since hydrogen is lighter than oxygen its molecules will move faster than oxygen at a given temperature. The rate at which hydrogen gas will diffuse is thus much faster than that of oxygen.
2. Temperature: Rate of diffusion increases with the increase in temperature as the particles have more kinetic energy and hence they move faster. This eventually leads to rapid mixing and spreading.
Key point Different Gases Diffuse at Different Rates
Different gases diffuse at different rates
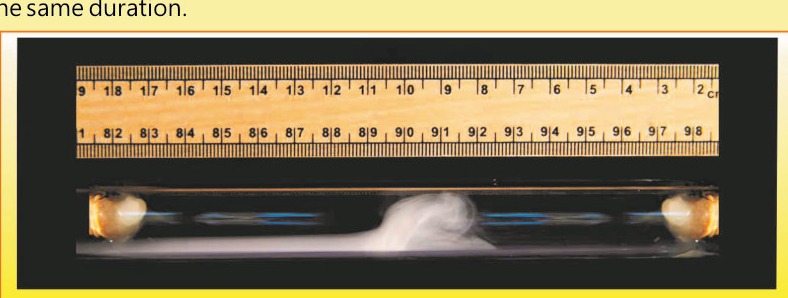
- Two cotton plugs soaked in hydrogen chloride gas and ammonia solutions are introduced in the open ends of a 100 cm long glass tube simultaneously as shown in figure 14.7.
- The two gases produce white dense fumes of ammonium chloride at the point at which they meet in the tube.
NH₃ + HCl ⟶ NH₄Cl
- HCl molecules travel a distance of 40.5 cm while ammonia molecules cover 59.5 cm in the same duration.
Result Thus ammonia diffuses faster than hydrogen chloride gas because it is lighter than hydrogen chloride gas.
Figures Fig 14.7: Rates of diffusion of gases
Key point Importance of Rate of Diffusion of Medicines in Human Body
Importance of rate of diffusion of medicines in human body
The tendency of the molecules contained in a medicine to move from a region of higher concentration to one of lower concentration is called diffusion.
Rate of diffusion of medicine in human body
- The diffusion rates of medicines control how rapidly and effectively they can be absorbed, distributed and eliminated from the body.
- When the medicines are taken orally, the rates of their diffusion between the stomach and intestine control how quickly they are absorbed in the blood. A faster diffusion rate means early absorption and hence a faster onset of action.
- Once the drug molecules are absorbed by the blood, they start diffusing into various tissues and organs. The rate of diffusion here determines how quickly the drug becomes effective.
- Example: Lipid-soluble drugs diffuse more easily through cell membranes, making them more effective in shorter time.
- Generally, a faster rate of diffusion leads to higher drug concentration at its target organ which means a more effective response.
Benefits of rate of diffusion of medicines in human body
Rates of diffusion play a crucial role in the delivery and movement of drugs throughout the body. This process of diffusion ensures that essential substances reach their target locations quickly which eventually helps in the treatment of diseases.